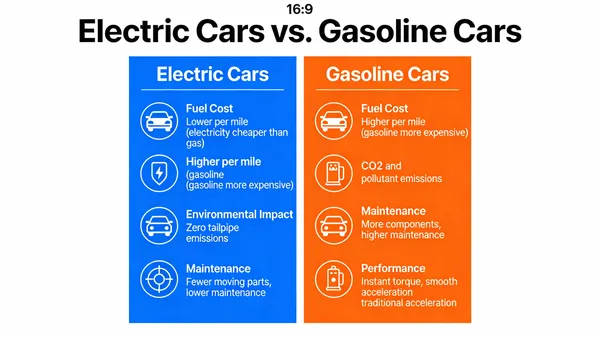
No. 44: Electric vs. Gasoline Cars Comparison
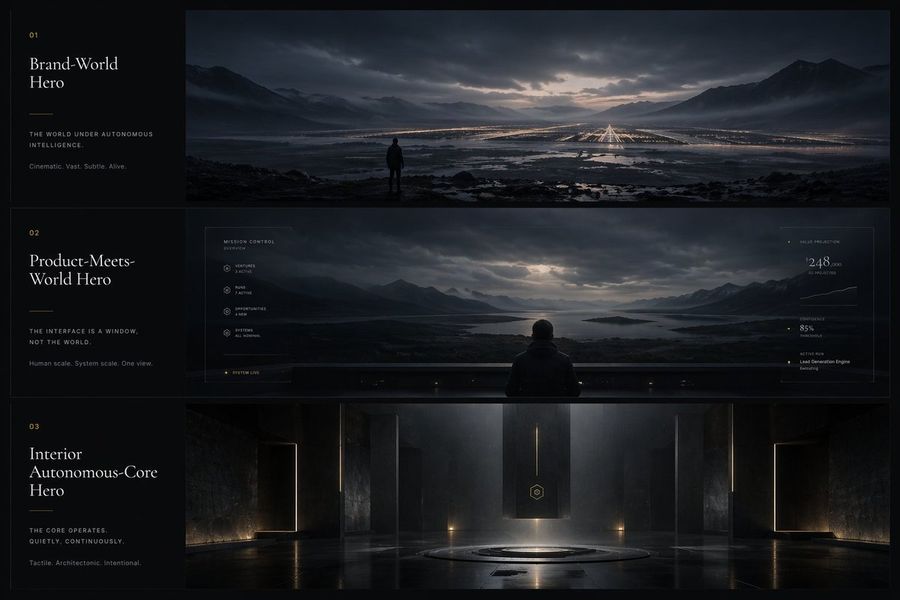
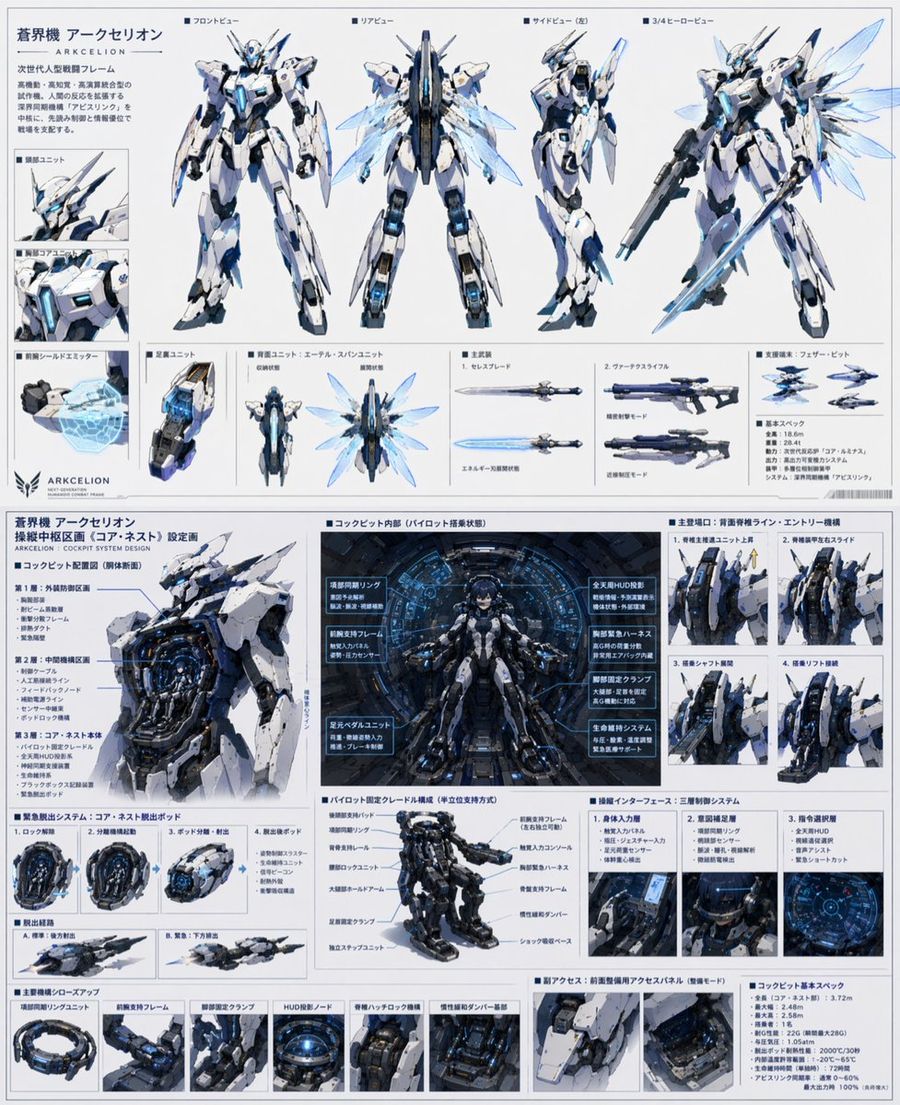
What this prompt does: Produces a architecture interior image using Seedream 5. Style cues: minimalist, cinematic. Sourced from a verified CC-BY-4.0 repository (Jared Liu) and reproduced here unchanged with full attribution per the source license.
A visual comparison chart (a “vs.” infographic) comparing electric cars and gasoline cars. The chart should have two columns, with icons and brief text comparing them on factors like Fuel Cost, Environmental Impact, Maintenance, and Performance. The design should be clean, modern, and easy to understand at a glance, demonstrating the ability to visually organize and present comparative data. –ar 16:9