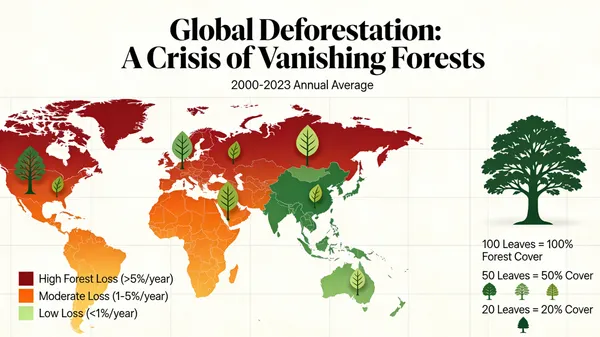
No. 42: Global Deforestation Data Visualization
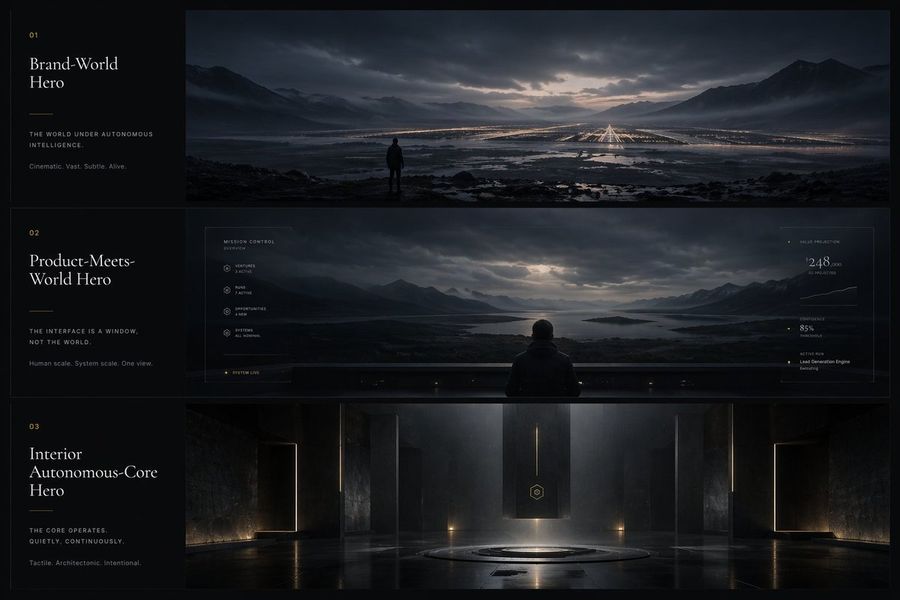
What this prompt does: Produces a architecture interior image using Seedream 5. Style cues: cinematic, dramatic. Sourced from a verified CC-BY-4.0 repository (Jared Liu) and reproduced here unchanged with full attribution per the source license.
A beautiful and informative data visualization for a report on global deforestation. The main visual could be a world map where countries are colored based on their rate of forest loss, or a series of stylized tree graphics where the number of leaves represents the remaining forest cover. The design should be impactful and emotionally resonant, not just a dry chart, demonstrating the ability to turn data into a compelling visual story. –ar 16:9


![In the Day of [SUBJECT]": Design a 12-Panel (4x3) Cinematic Timeline — Nano Banana Pro image prompt example](https://pub-c5e3d660d0a241c5895facb8ff762e97.r2.dev/media/youmind/nano-banana-pro-12.jpg)


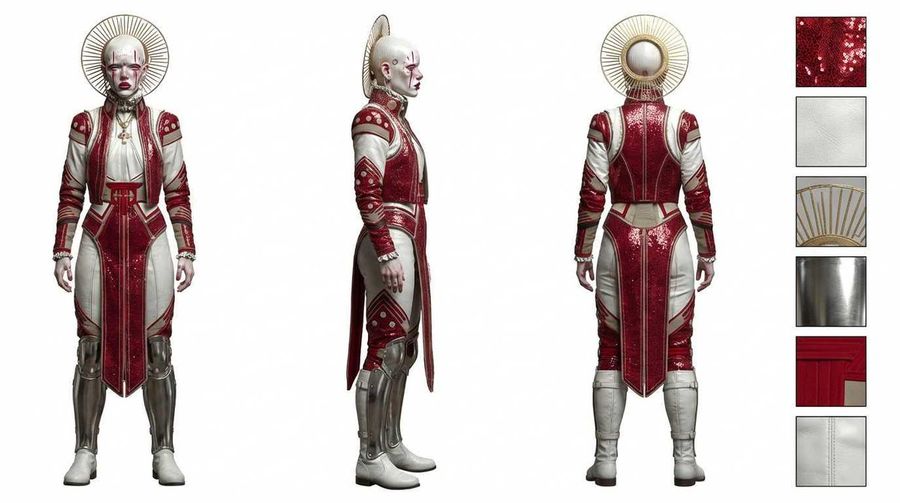
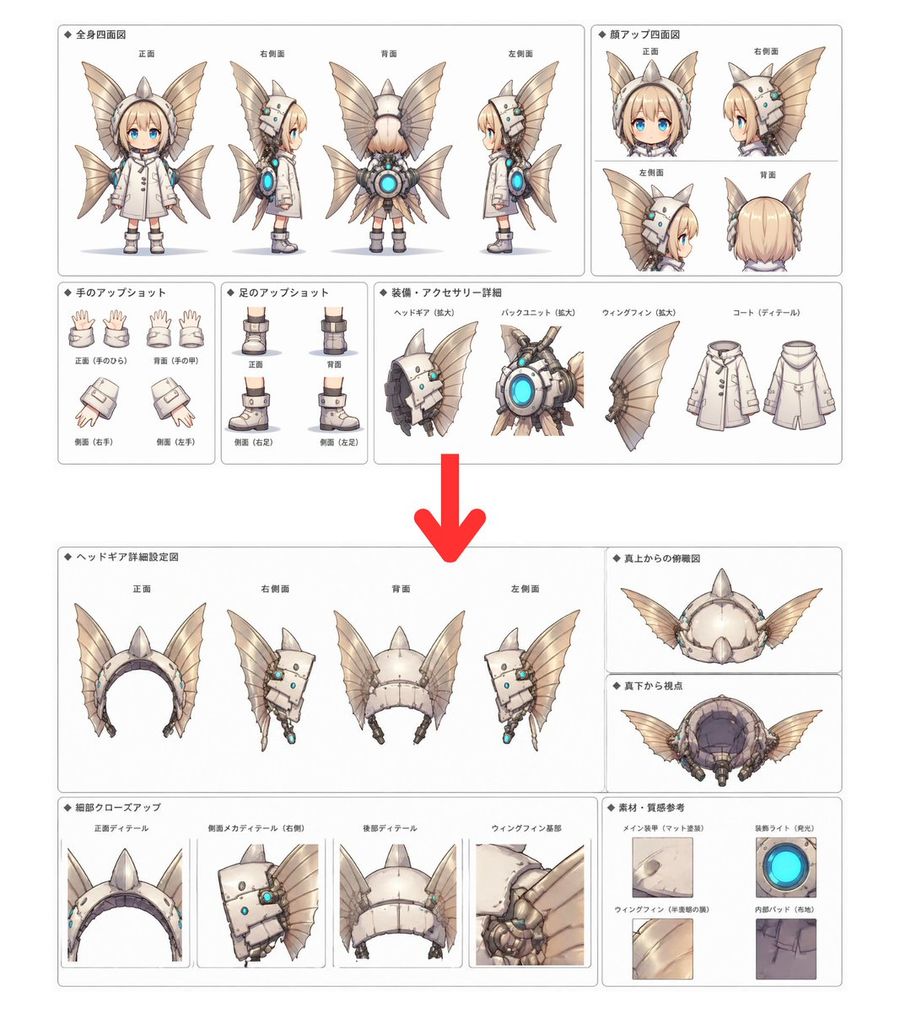
![Anchor: [Uploaded Image]::3 — Nano Banana Pro image prompt example](https://pub-c5e3d660d0a241c5895facb8ff762e97.r2.dev/media/youmind/nano-banana-pro-5113.jpg)